
I have added an air quality monitor to my weather station (see below). The sensors I am using are the Plantower PMS5003 sensorto measure particulate matter and the Winsen ZE-07CO carbon monoxide sensor. I have used a Raspberry Pi to capture and process the data and upload xml files to the internet to display the recorded data on my website. The software is based on that produced by https://www.rigacci.org but I have adapted it to display current and historical information on my website. I am also uploading the information to Weather Underground (Wunderground), although at present, Wunderground does not seem to display this data nor make it available for historical analysis.
The information I am recording is 'Particulate Matter' PM1.0, PM2.5 and PM10. These are particles with a diameter of 1.0μm or less, 1.0μm to 2.5μm and 2.5μm to 10μm respectively. The latter two are measured for air quality monitoring. The differences between these are as follows:
The measurements recorded are in μg/m3. On my website I give the current reading and the highest reading recorded during the day. Additionally, I calculate the Air Quality Index (AQI) for each type of particle. Around the world different methods are used for defining AQI; I use that defined by Environment NSW.
I am also recording Carbon Monoxide concentration. This is measured in Parts Per Million (PPM) and is averaged over the day. There is a natural level in the atmosphere but the main contributor to carbon monoxide in the environment is from motor vehicles. Bushfires are also a source of carbon monoxide.
Different states and countries set different thresholds for acceptable levels of the particulates. In NSW, the safe levels are as follows:
| PM2.5 | PM10 | |
| 24 hour average | 25 μg/m3 | 50 μg/m3 |
| Annual average | 8 μg/m3 | 25 μg/m3 |
The AQI is calculated using the 24 hour average value equating to an AQI of 100. The following table, again from Environment NSW defines the action to be taken depending on the recorded AQI.
The Australian Department of Environment and Energy website advises that the safe level for exposure to Carbon Monoxide over an 8 hour period is 9.0ppm.
During late October and early November 2019 there were significant bushfires in Northern NSW. On Wednesday 30 October, a hazard reduction burn was carried out nearby in Wahroonga from 10 a.m. Later that day, due to a northerly wind, significant quantities of smoke from the bushfires reached Sydney. Although some periods of improved air quality were experienced, the smoke continued for a number of days. The map below shows the location of the main bushfires being in the North Coast area of NSW. The graph shows the PM2.5 particle readings and the 'safe' 24 hour levels as a comparison.


| Here is the air quality sensor I used - the PMS5003. These are readily available on eBay for about $30. | 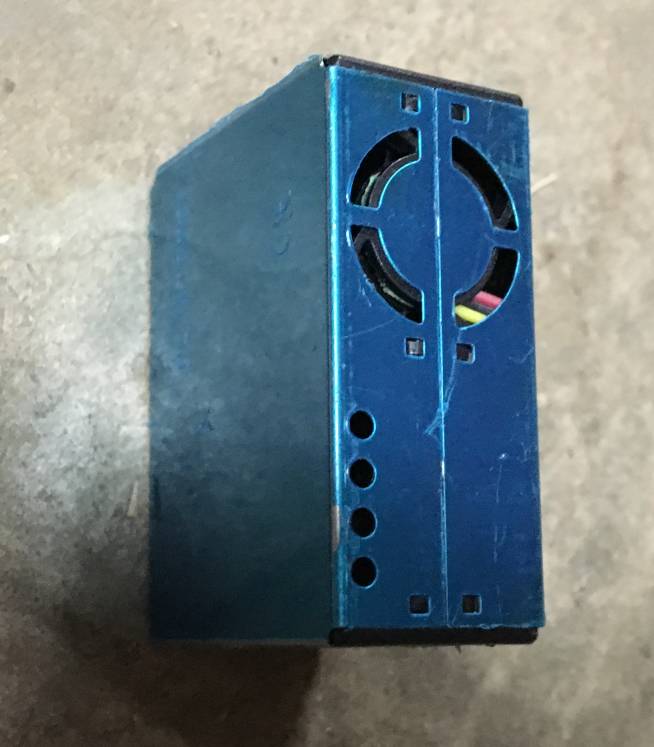 |
| Here is the Carbon Monoxide Sensor I use - the Winsen ZE-07CO. They are available on eBay for about $20. |  |
| I used a Raspberry Pi in a weatherproof housing (from Jaycar electronics - but available from many suppliers) to connect to the sensor and transmit the information via WiFi. I bought a rain cowl from Bunnings to go over the air sensor but still allow the air to be measured (see image on the main page). | 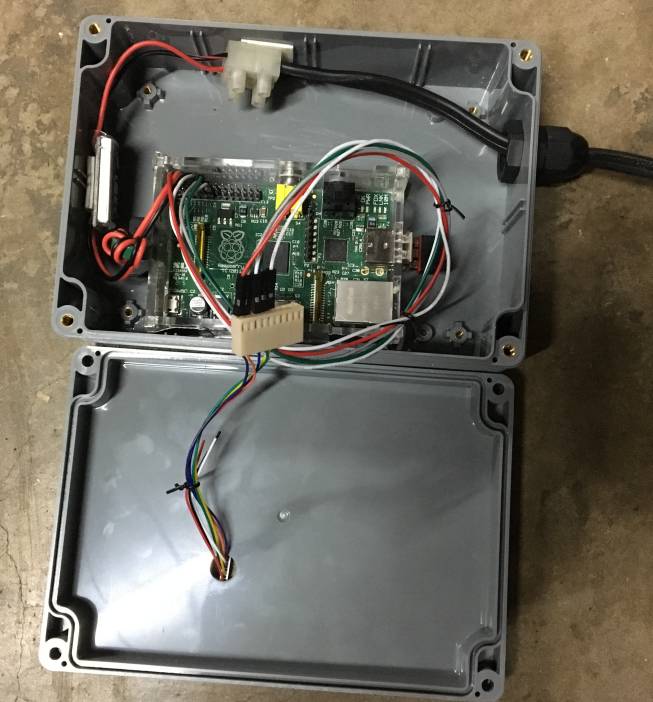 |
For further information, the following links may be useful:
http://www.environment.nsw.gov.au/AQMS/aqi.htm
https://en.wikipedia.org/wiki/Particulates
http://www.epa.vic.gov.au/your-environment/air
https://www.epa.gov/pm-pollution/particulate-matter-pm-basics
If you have any comments, or want any information, please send me an email at steve@tijou.co.uk.
This page was last updated 12 January 2020.
Click here to go to the main weather page.